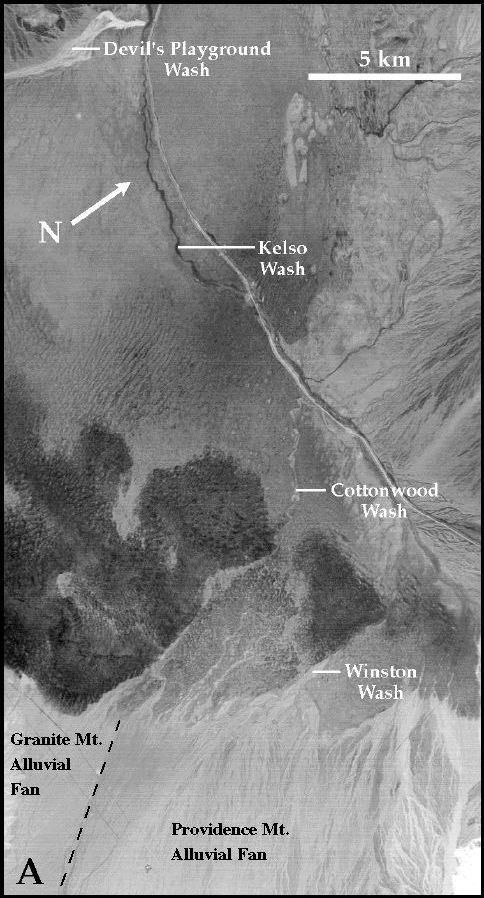
Figure 3a. Products of the emissivity-temperature separation of the TIMS data. Band 3 (9.2 micron) emissivity image with darker areas indicating emissivity lows or strong absorptions. The areas of active sand show the largest absorption indicating the presence of quartz and feldspar. In contrast, dolomite in the Providence Mountains and the large amount of magnetite and clay in the washes have the weakest spectral features and appear brightest [Ramsey, et al., 1999]. |